Creating a SharePoint Org Chart from OrgPlus
As an organisation you may be using an organisation chart modelling software packages, such as Insperity OrgPlus, to model your organisation. It is easy to export data from tools like this to create an interactive organisation chart on your company SharePoint site.
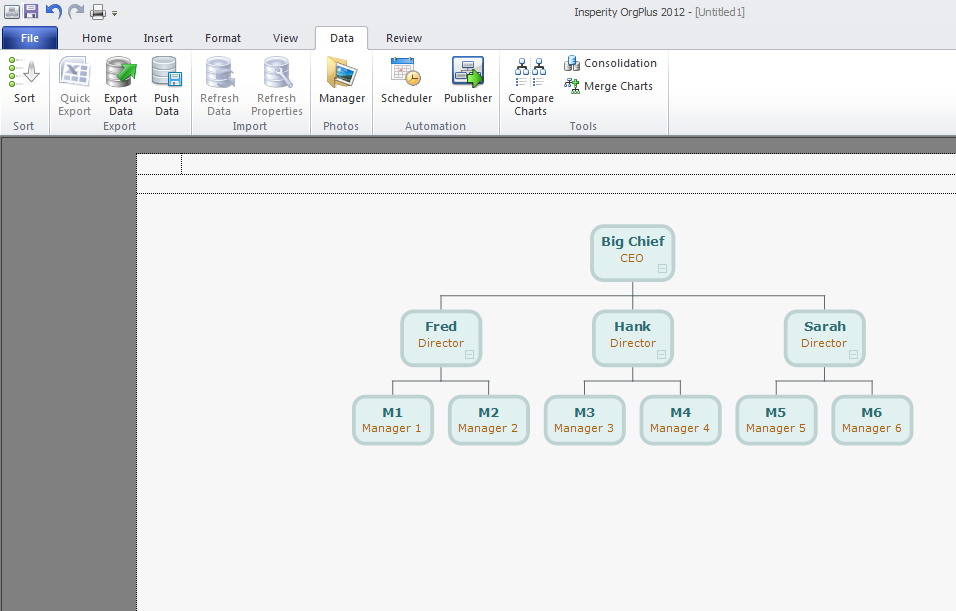
Organisation Chart using Insperity OrgPlus 2012
In this guide we walk through the steps required to export the organisation chart data held within OrgPlus, import it into SharePoint 2010 and then create an organisation chart from it.
Although this guide focuses on OrgPlus it is applicable to many other types of organisation chart software.
Export the organisation chart data
From the Data menu select the Export Data option. This will open the Export Data window.
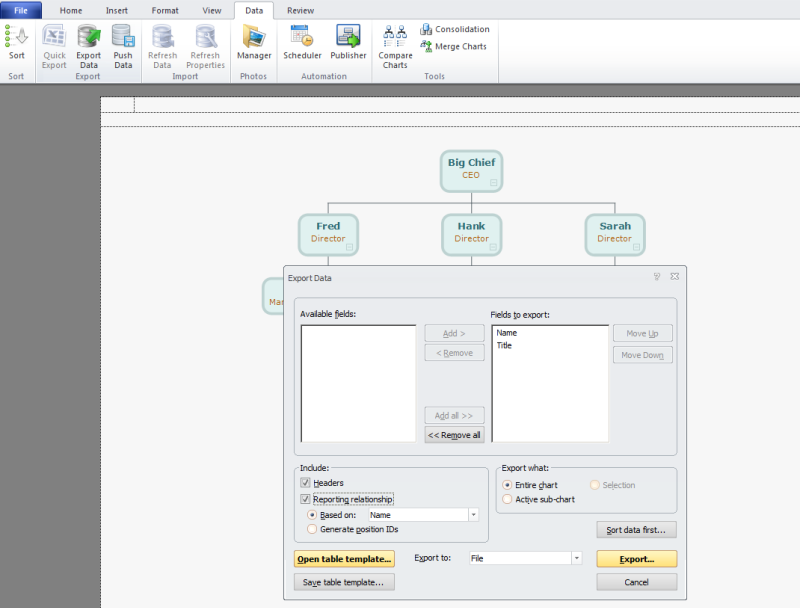
Exporting the information
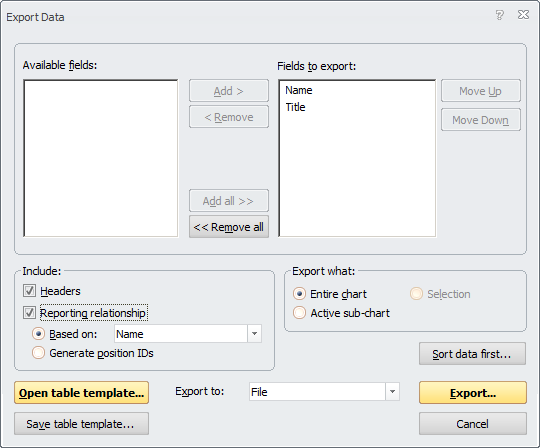
Choose the information that you wish to export from the Org Chart and most importantly ensure that the Reporting relationship option is checked. Press the Export button and save the data as a "CSV" file type onto your desktop.
Importing the org chart data into a SharePoint list
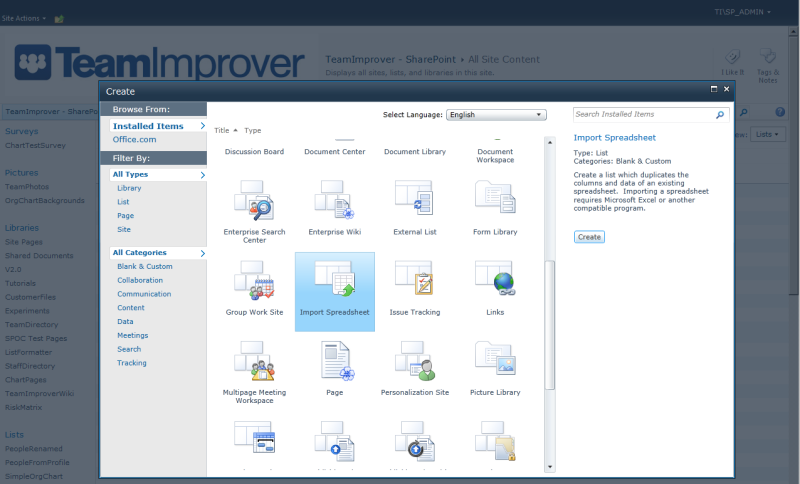
Within SharePoint 20 Click View All Site Content, and then click Create on the All Site Content page. Under Custom Lists, click Import Spreadsheet
For further information on creating lists from a spreadsheet refer to this article and this.
Creating the SharePoint list
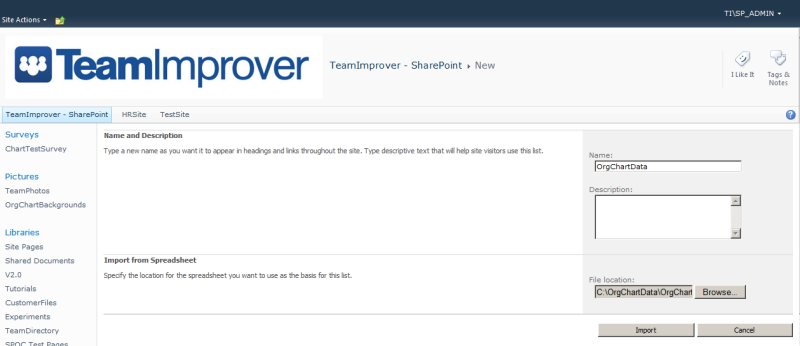
Enter a name for the list in Name and browse to the .csv file location that you saved earlier and press Import
Selecting the data to import
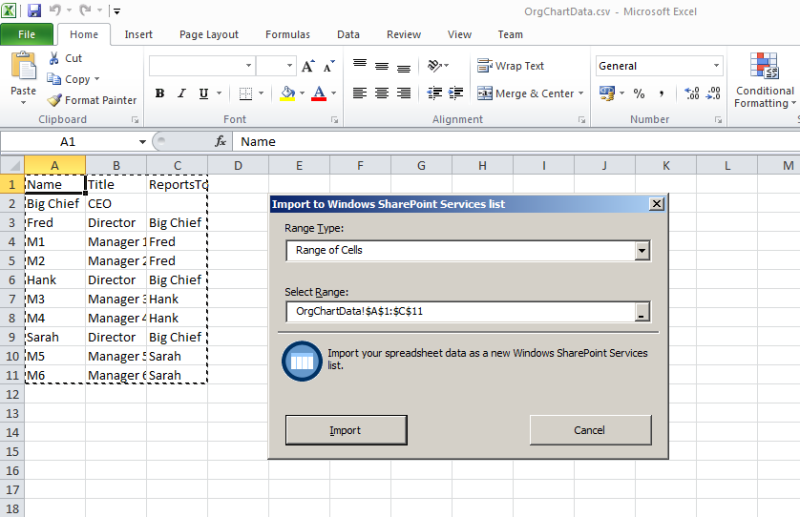
Microsoft Excel will open, change the Range Type to Range of Cells and then use the Select Range option to select the full range of data that you require and press Import
The imported data

Once the data import has completed you will be returned to SharePoint and will see the newly created list.
SharePoint will rename any field called "Name" or "Title" as these names reserved by all SharePoint lists. In this example the columns Name1 and Title1 have been created.
Configuring the SharePoint Org Chart to use the list

Add a SharePoint Org Chart to a web part page ( See article for more details ). Once this has done select the option to create a chart from an existing list and press Next.
Configuring the SharePoint Org Chart Data.
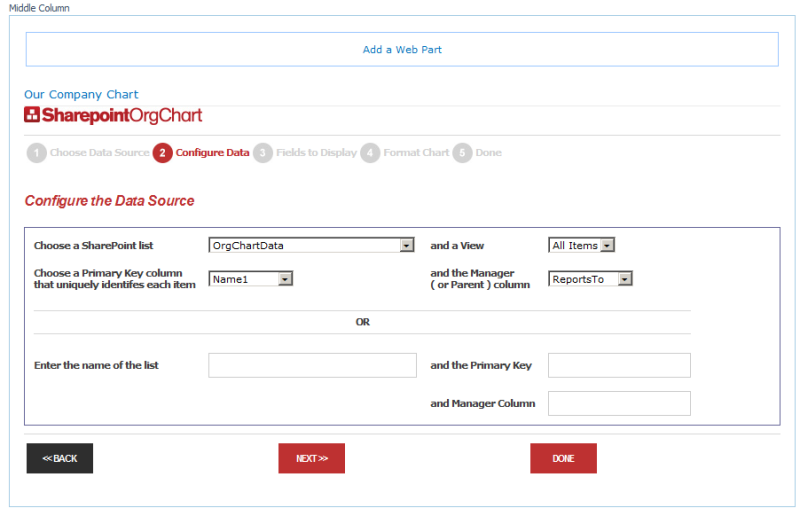
In the Configure Data screens choose the SharePoint list created by the Excel spreadsheet import process from the drop down menu and choose Name1 as the primary key and ReportsTo as the manager.
Selecting the information to show.

Choose Name1 and Title1 from the available columns.
Formatting the organisation chart.

As the list does not contain pictures set the Template Style list to NoPhoto and use this page to set any other style options that you require.
The completed organisation chart.
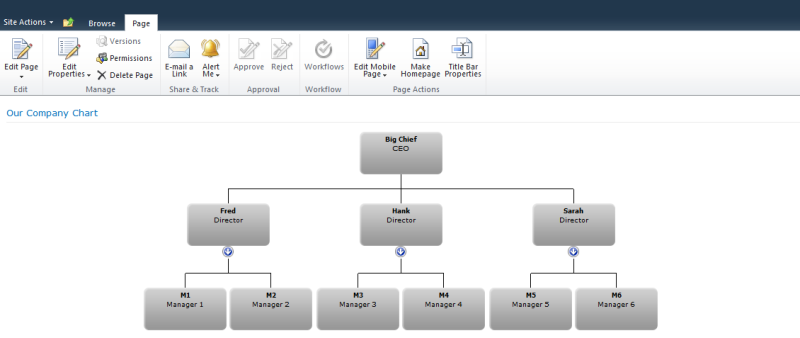
Once you exit the configuration wizard the organisation chart will be displayed. You can go on to add the search, information and StartPart webparts to build up a feature rich, interactive organisation chart page for your end users.