Using CSS and JQuery to Style a Chart
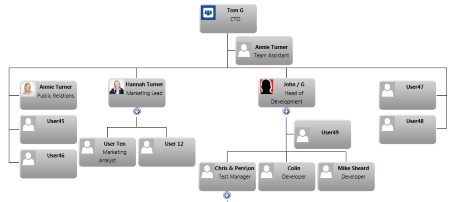
This guide walks through some of the options available to the page developer to style an organization chart using JQuery and/or CSS.
The SharePointOrgChart includes it's copy of the JQuery library. To prevent any clashes with existing JQuery libraries that may have been included within the same page ( either directly in the page or via a master page ) SharePointOrgChart uses $spoc to access JQuery.
Defining the Box Color with CSS
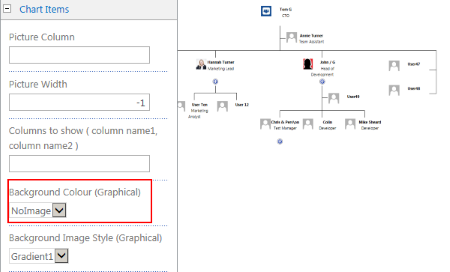
Starting with an out-of-the-box organization chart the page author sets the Chart Items > Background Colour to NoImage.
This removes the background images that are being used to color the chart boxes.
Available CSS Classes
The page author can set the CSS classes to be used within the boxes by setting the JQuery & CSS > CSS Property.
This property injects a CSS style sheet into the page or if preferred the page author could include the styles in a separate style sheet by using the built-in ScriptLink web part or by modifying the master page.
- SPOCBG - the class associated with the HTML div that contains the box contents.
- SPOC_FirstField - the class associated with the first displayed field within a box.
- SPOC_Field - the class associated with each displayed field within a box.
- SPOC_Image - the class assigned to each image within a box.
In addition the following classes are used depending on the box type.
- SPOCItem_ChartItem - identifies the standard chart items
- SPOCItem_AssistantItem - identifies the assistants
- SPOCItem_StackItem - identifies the stacked items.
And finally to target a specific field SharePointOrgChart generates a class for each field. If the page author is showing the fields title and fullname SPOC will assign the classes SPOC_title and SPOC_Fullname to those fields respectively.
Setting the Box Background

In this example the page author defines the SPOCBG class as:
.SPOCBG { border : solid black 1px;background-color:#e1e1e1 }
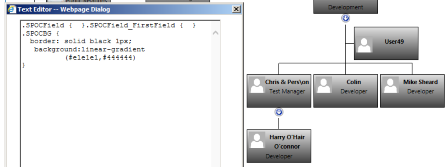
And SPOCBG is defined as:
.SPOCBG{ border:solid black 1px;
background:linear-gradient(#e1e1e1,#444444)}
To give a gradient effect.
Using JQuery to Style the Boxes
SharePointOrgChart can use JQuery to adjust the styles used within each box. To do this the page author can simply add some JQuery to the JQuery & CSS > Customer JQuery configuration section. This code will be executed each time the chart is drawn and whenever the chart is naviaged.
SharePointOrgChart uses a JQuery function called $spoc to prevent any clashes with other JQuery libraries that may have already been linked to the page.
The page author can specific one or more JQuery Data Fields by setting the JQuery & CSS > Data Fields property.
Example Using JQuery
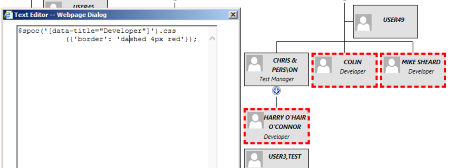
In this example the page author has set the JQuery & CSS > Data Field to title
And the Custom JQuery to:
$spoc('[data-title="Developer"]').css({'border':'dashed 4px red'});
To change the border style boxes with a title of "Developer"