SharePointOrgChart examples
Here are a variety of organization charts or organograms that can be created with SharePointOrgChart
Easy to use
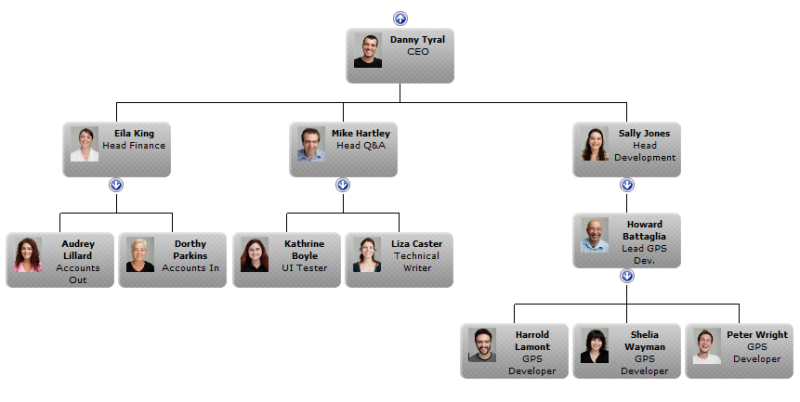
This is the out-of-the-box organisation chart created by adding the SharePointOrgChart to a web part page.
It is connected to the user profile service and no further configuration was required.
Styles and colours

The default colour scheme can be easily changed by selecting one of the built in styles.
Or you can create your own custom background.
Conditional formatting
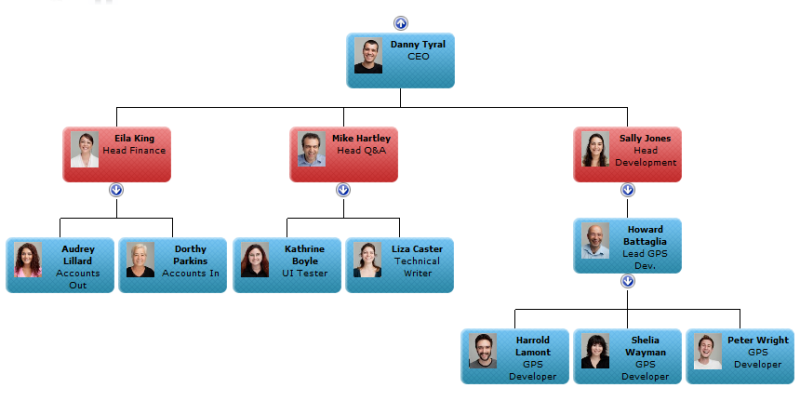
Easy to use conditional formatting features allow you to highlight important aspects of your organization. SharePointOrgChart allows you to define rules that can vary the appearance of each box within your organisation.
Display assistants

Assistants can be shown with ease and people can have one, two or more assistants!
For more information see how to guide here.
Dotted Line Reports
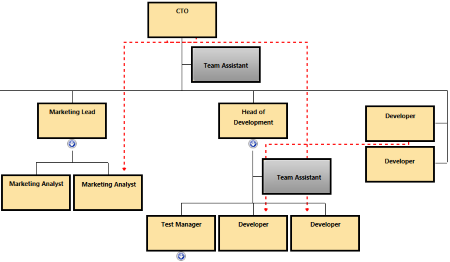
SharePointOrgChart supports dotted-line reporting. Allowing you to model complex organizations accurately.
Print to PDF
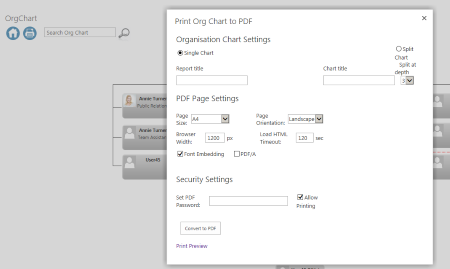
Print your organization chart to PDF or export the data to Excel.
Large charts

The drawing algorithms work to maximise the amount of information shown on the chart. Allowing large organizations to be displayed.
The navigation features allow end users to search and traverse the organization chart with ease.
Easy to Search

Use the search box to quickly locate people within your organization.
View Additional Information
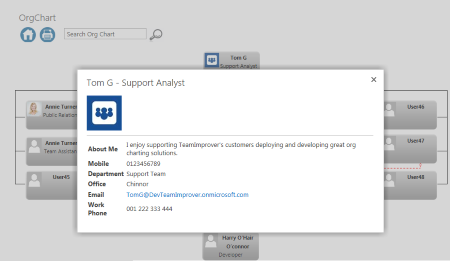
Select an individuals box to view more information on them and quickly access their personal site.
Supporting web parts
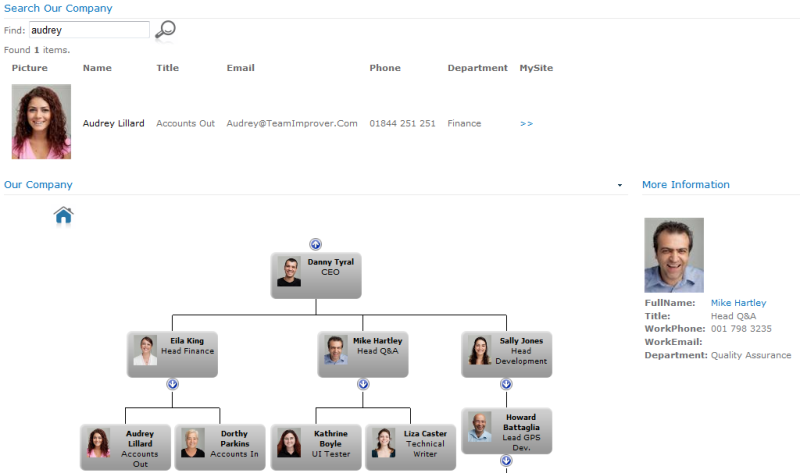
The SharePointOrgChart comes with a number of supporting web parts to allow searching, displaying of detailed information and controlling the start position.
To find out more about SharePointOrgChart features check out our how to guides & tutorials here or download our FREE demo below.